A dashboard is useful when it helps someone understand a situation and decide what to do. It can look impressive while leaving those questions unanswered. A collection of charts showing visitors, orders and response times does not explain which figure matters to a particular team, whether the data is current or what action should follow a change.
Design the dashboard around the questions people actually ask during their work. Define each question, the decision it supports and the information needed to answer it. Then choose the layout and charts. This sequence helps you build a reporting tool that people can use confidently and maintain as the business changes.
Observe the reporting conversation before designing
Listen to an ordinary team meeting or review the messages people send when they need information. Capture the question in the person's own working terms. Examples might include which enquiries are waiting for a reply, whether a campaign produced useful requests or which jobs are approaching their agreed completion date.
Ask what the person does once they receive an answer. A manager may redistribute work, a customer service colleague may contact a customer, or a marketing team may investigate a landing page. If the answer leads to no plausible action or useful understanding, question whether it belongs in the first dashboard.
Include the timing of the decision. A weekly planning meeting and a team managing today's enquiries need different views. The same underlying records can support both, but the refresh and presentation requirements may differ substantially.
Give each audience a clear purpose
Identify the people using the dashboard and what they need to see. An operational team may need specific cases requiring attention, while a leadership review may need trends and explanations. Combining every level of detail into one screen can make both tasks harder.
Start a dashboard brief with the audience and the metrics that support their decisions. Include relevant context and keep the presentation uncluttered. These principles apply across reporting platforms, but the final layout should be tested against the team's actual questions. Our dashboard design and data quality guide provides the related checks.
Write a short purpose statement for each view. For example, an enquiry dashboard might help the team identify requests awaiting action and understand the reasons for delay. That purpose gives you a basis for deciding which information is essential and which belongs in a supporting report.
Define the measures before calculating them
Create a metric register with the name, meaning, calculation, source and owner of each measure. Specify what is included and excluded. An enquiry could mean a submitted form, a confirmed request after spam review or a potential customer accepted by the sales team. Those definitions produce different counts.
Define the dates used. A request's creation date, first response date and completion date answer different questions. A chart labelled this month's enquiries should explain whether it counts requests received this month or cases processed during that period.
Include examples that test the definition. How should a duplicate submission be counted? What happens if a case is reopened? Does a request received through telephone contact enter the same measure? Agree these cases with the team before relying on the number in a meeting.
Map each question to the required evidence
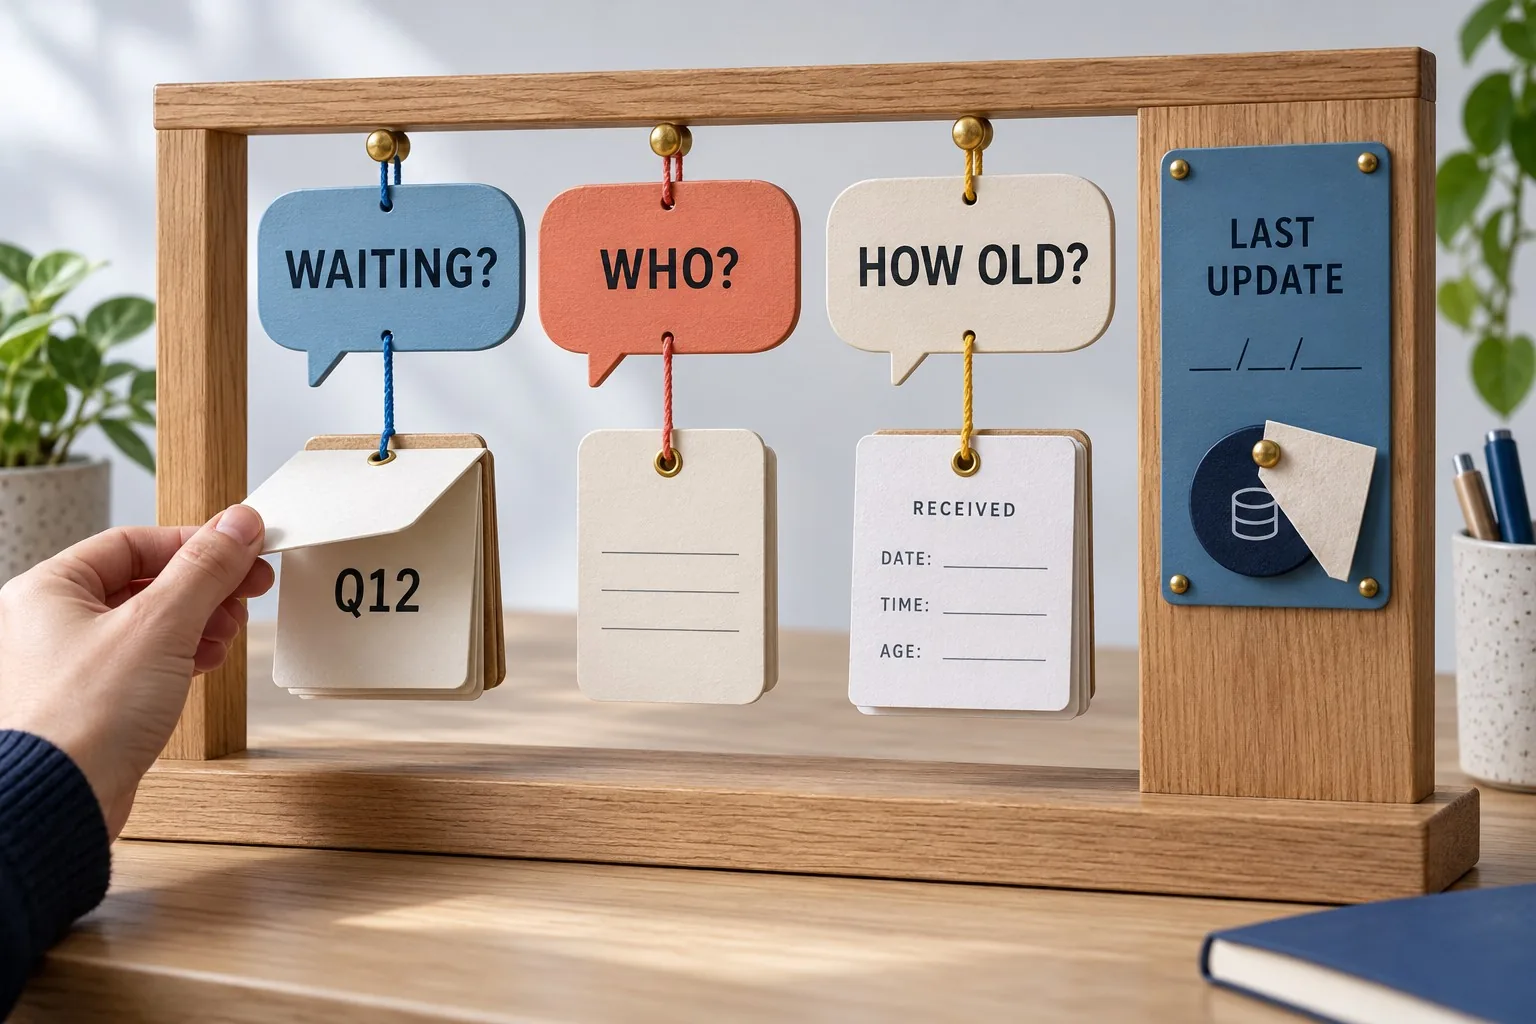
For each question, list the fields needed to answer it. To find enquiries waiting for a reply, you may need receipt time, current status, assigned owner and the relevant response event. A simple total cannot identify which requests require attention.
Check whether those fields exist and are used consistently. If staff update status informally in notes, a dashboard cannot reliably infer the operating state without an agreed process. The reporting project may reveal a data capture problem that needs to be solved first.
Keep limitations visible in the brief. A measure based on incomplete records can still offer some information, but its use needs to reflect that limitation. Avoid filling missing values with convenient defaults that make the dashboard appear more complete than its evidence.
Choose a presentation that matches the question
Use a trend when the question concerns change over time. Use a comparison when the question concerns differences between categories. Use a table when the team needs to identify and act on individual records. The chart type should follow the task rather than a desire to display variety.
Add labels that explain the measure, period and scope. A number showing outstanding cases needs enough context to establish what outstanding means and when the data was last refreshed. The reader should not need to remember a separate verbal explanation each time they use it.
Be careful with visual emphasis. A red card implies that something needs attention, so define the condition behind that signal. If the threshold is merely an arbitrary design choice, it can encourage unnecessary alarm or hide a genuinely important change elsewhere.
Plan refresh and failure behaviour
Decide how current the information needs to be for the decision. A planning dashboard might work with a scheduled daily refresh. A view used to allocate incoming work may need more frequent updates. Ask the developer what the sources can support and what the operating cost of the proposed arrangement includes.
Show when the data was successfully updated and distinguish that from the time someone opened the dashboard. A page loading now does not mean its underlying information is current. Make the difference understandable to the people relying on it.
Define what happens if a source fails or a refresh is incomplete. The system should help users recognise stale or partial information and find an appropriate fallback. Decide who investigates the failure and how the team will continue its work while the reporting issue is resolved.
Design detail routes for investigation
A summary should give users a sensible route to the evidence behind it where their access permits. If the dashboard shows an increase in delayed enquiries, the team may need to inspect the affected cases, service categories or periods before deciding what to change.
Keep filters clear and consistent. Someone should be able to see which location, team or date range is selected. A filtered view that looks identical to the full view can create contradictory reports when people discuss different subsets without realising it.
Plan permissions around the underlying information, not just the appearance of the screen. Ask the responsible administrator to verify which records and fields each audience may see, including any export or detail view. Hiding a panel visually is not a substitute for appropriate access controls.
Prototype with realistic questions and records
Build an initial layout using suitable sample data and ask team members to complete their normal reporting tasks. Can they identify a request needing action? Can they explain a change in the trend? Can they tell whether the data is current?
Include difficult examples: missing information, an empty category, a reopened case and a failed refresh. A layout that works only with tidy demonstration data may become confusing during ordinary use. Observe where people hesitate and revise the labels or structure accordingly.
Check the actual viewing conditions. A dashboard displayed on a large meeting-room screen has different practical constraints from one used on a phone between appointments. Prioritise the information that users need in that setting and provide detail through a workable route.
Validate the numbers against known cases
Compare the dashboard with a small set of records the team understands. Recalculate the relevant measures and explain any differences. Test dates, filters, duplicates and exclusions. A reassuring chart should not replace this reconciliation.
Record the validation results and the accepted limitations. Where a definition remains disputed, resolve the business question before describing the dashboard as authoritative. Accurate arithmetic cannot repair an unclear definition of the thing being counted.
Assign an owner for future changes to measures, sources and access. Giraffe Digital's digital strategy service can help connect reporting requirements to the tools and journeys behind them. A useful dashboard earns trust through understandable questions, clear definitions and evidence that supports the decisions your team needs to make.
Frequently asked questions
How should we observe the reporting conversation before designing?
Listen to an ordinary team meeting or review the messages people send when they need information. Capture the question in the person's own working terms. Examples might include which enquiries are waiting for a reply, whether a campaign produced useful requests or which jobs are approaching their agreed completion date. Ask what the person does once they receive an answer. A manager may redistribute work, a customer service colleague may contact a customer, or a marketing team may investigate a landing page. If the answer leads to no plausible action or useful understanding, question whether it belongs in the first dashboard. Include the timing of the decision. A weekly planning meeting and a team managing today's enquiries need different views.
How should we define the measures before calculating them?
Create a metric register with the name, meaning, calculation, source and owner of each measure. Specify what is included and excluded. An enquiry could mean a submitted form, a confirmed request after spam review or a potential customer accepted by the sales team. Those definitions produce different counts. Define the dates used. A request's creation date, first response date and completion date answer different questions. A chart labelled this month's enquiries should explain whether it counts requests received this month or cases processed during that period. Include examples that test the definition. How should a duplicate submission be counted? What happens if a case is reopened? Does a request received through telephone contact enter the same measure?
How should we choose a presentation that matches the question?
Use a trend when the question concerns change over time. Use a comparison when the question concerns differences between categories. Use a table when the team needs to identify and act on individual records. The chart type should follow the task rather than a desire to display variety. Add labels that explain the measure, period and scope. A number showing outstanding cases needs enough context to establish what outstanding means and when the data was last refreshed. The reader should not need to remember a separate verbal explanation each time they use it. Be careful with visual emphasis. A red card implies that something needs attention, so define the condition behind that signal. If the threshold is merely an arbitrary design choice, it can encourage unnecessary alarm or hide a genuinely important change elsewhere.
How should we design detail routes for investigation?
A summary should give users a sensible route to the evidence behind it where their access permits. If the dashboard shows an increase in delayed enquiries, the team may need to inspect the affected cases, service categories or periods before deciding what to change. Keep filters clear and consistent. Someone should be able to see which location, team or date range is selected. A filtered view that looks identical to the full view can create contradictory reports when people discuss different subsets without realising it. Plan permissions around the underlying information, not just the appearance of the screen. Ask the responsible administrator to verify which records and fields each audience may see, including any export or detail view.
How should we validate the numbers against known cases?
Compare the dashboard with a small set of records the team understands. Recalculate the relevant measures and explain any differences. Test dates, filters, duplicates and exclusions. A reassuring chart should not replace this reconciliation. Record the validation results and the accepted limitations. Where a definition remains disputed, resolve the business question before describing the dashboard as authoritative. Accurate arithmetic cannot repair an unclear definition of the thing being counted. Assign an owner for future changes to measures, sources and access. Giraffe Digital's digital strategy service can help connect reporting requirements to the tools and journeys behind them. A useful dashboard earns trust through understandable questions, clear definitions and evidence that supports the decisions your team needs to make.